Ottawa · September 2026
Ottawa, this month in numbers.
1,010 sales, 4.8 months of inventory, and a benchmark price of $623,500.
The month at a glance
| Measure | Figure | Comparison |
|---|---|---|
| Residential sales | 1,010 | −6.6% year over year |
| MLS® HPI composite benchmark | $623,500 | −0.3% year over year |
| Single-family benchmark | $705,100 | |
| Townhouse benchmark | $546,500 | −2.2% year over year |
| Apartment benchmark | $380,800 | −6.1% year over year |
| Average sale price | $685,640 | |
| Median sale price | $625,000 | |
| New listings | 2,927 | |
| Active listings | 4,813 | |
| Months of inventory, Ottawa | 4.8 | 4.1 a year ago |
| Median days on market | 27 | 22 a year ago |
| Average sale-to-list ratio | 97.5% | 98.1% a year ago |
| Suburbs' share of sales | 72.7% |
Where the market is tighter, and looser
Months of inventory is how long today's listings would last at the current pace of sales. Lower means tighter.
Hairline: Ottawa-wide figure, 4.8 months
The same numbers on the map
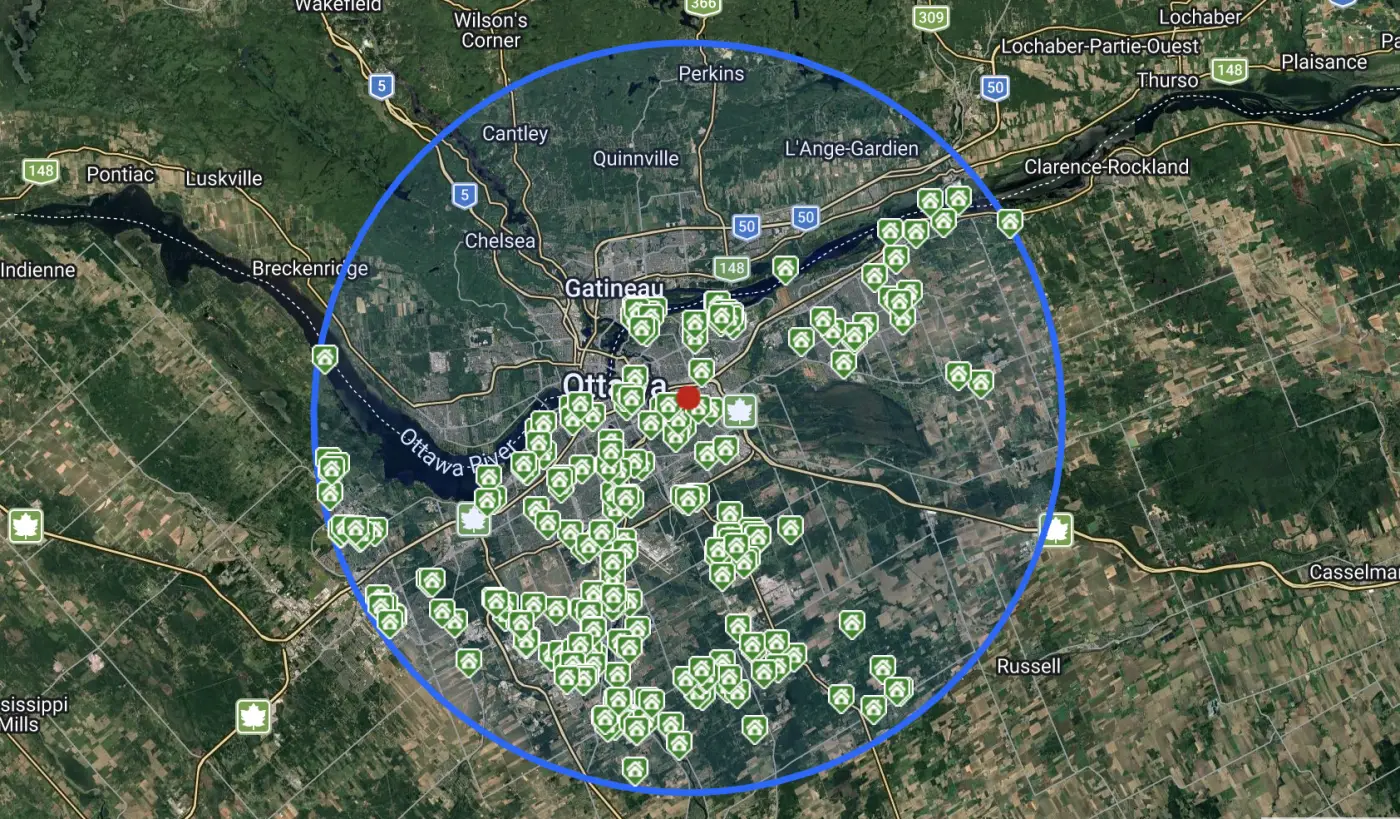
3.7West
4.4South
4.3East
6.8Centre
5.8Rural W
6.3Rural E
6.5Rural S
Source: Ottawa Real Estate Board (OREB), September 2026 release. Figures are as published by OREB.
General information, not financial advice.
Monthly numbers by email
Get the Ottawa numbers each month.
One short email when OREB publishes: sales, prices, months of inventory, and what it means for your move.